
Gateway Analyzer appears in Diagnostics > Gateway Analyzer.
Summary
Summary provides a high-level operational view of the latest analysis, including the health score and active findings. Use Refresh when a new review is required. Use Print to create a browser-based print view for approved reporting workflows.
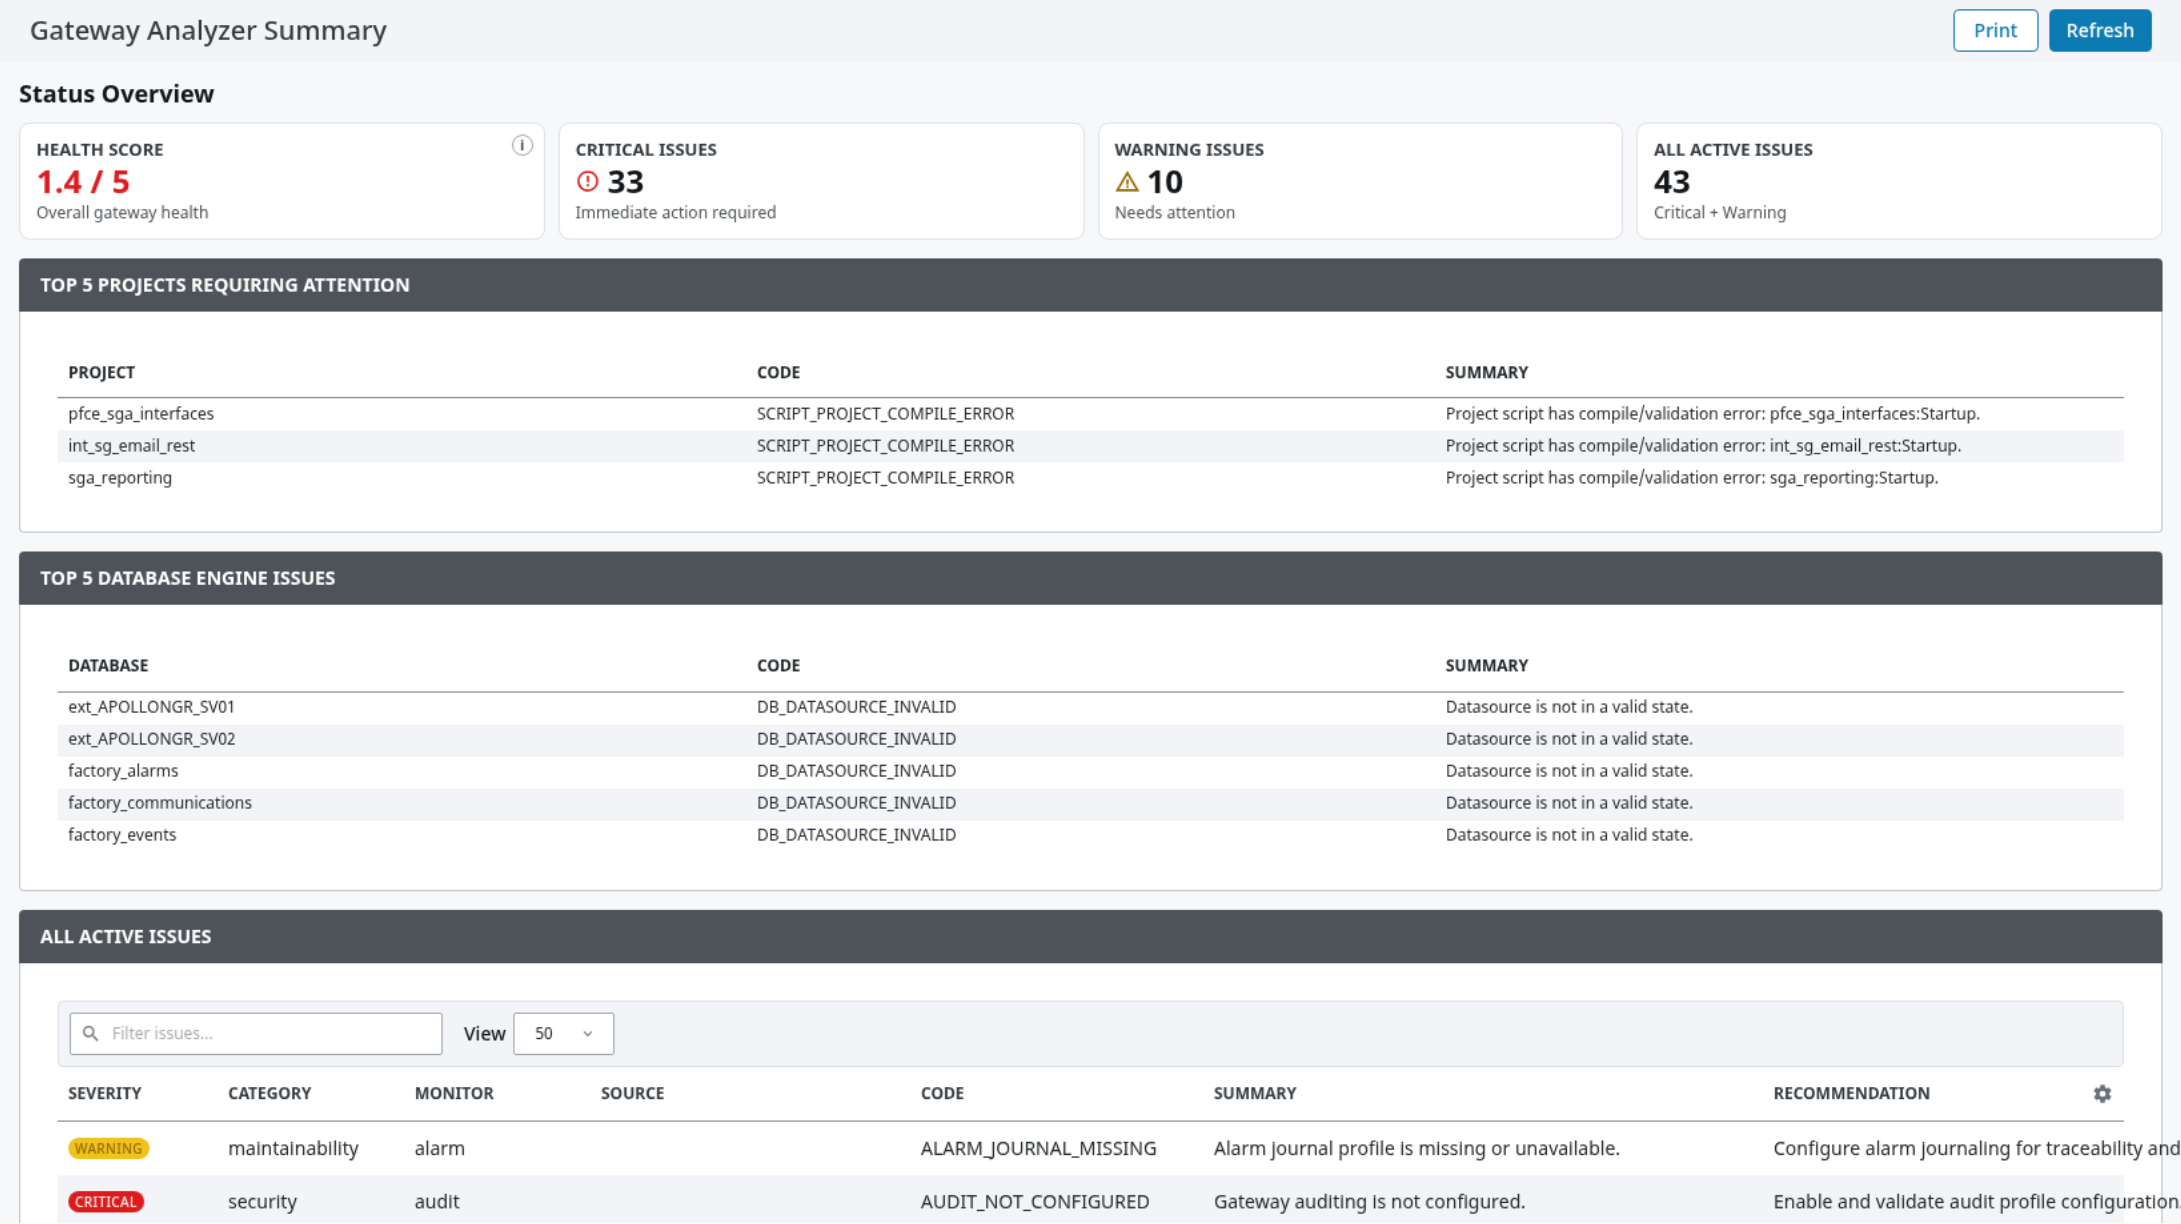
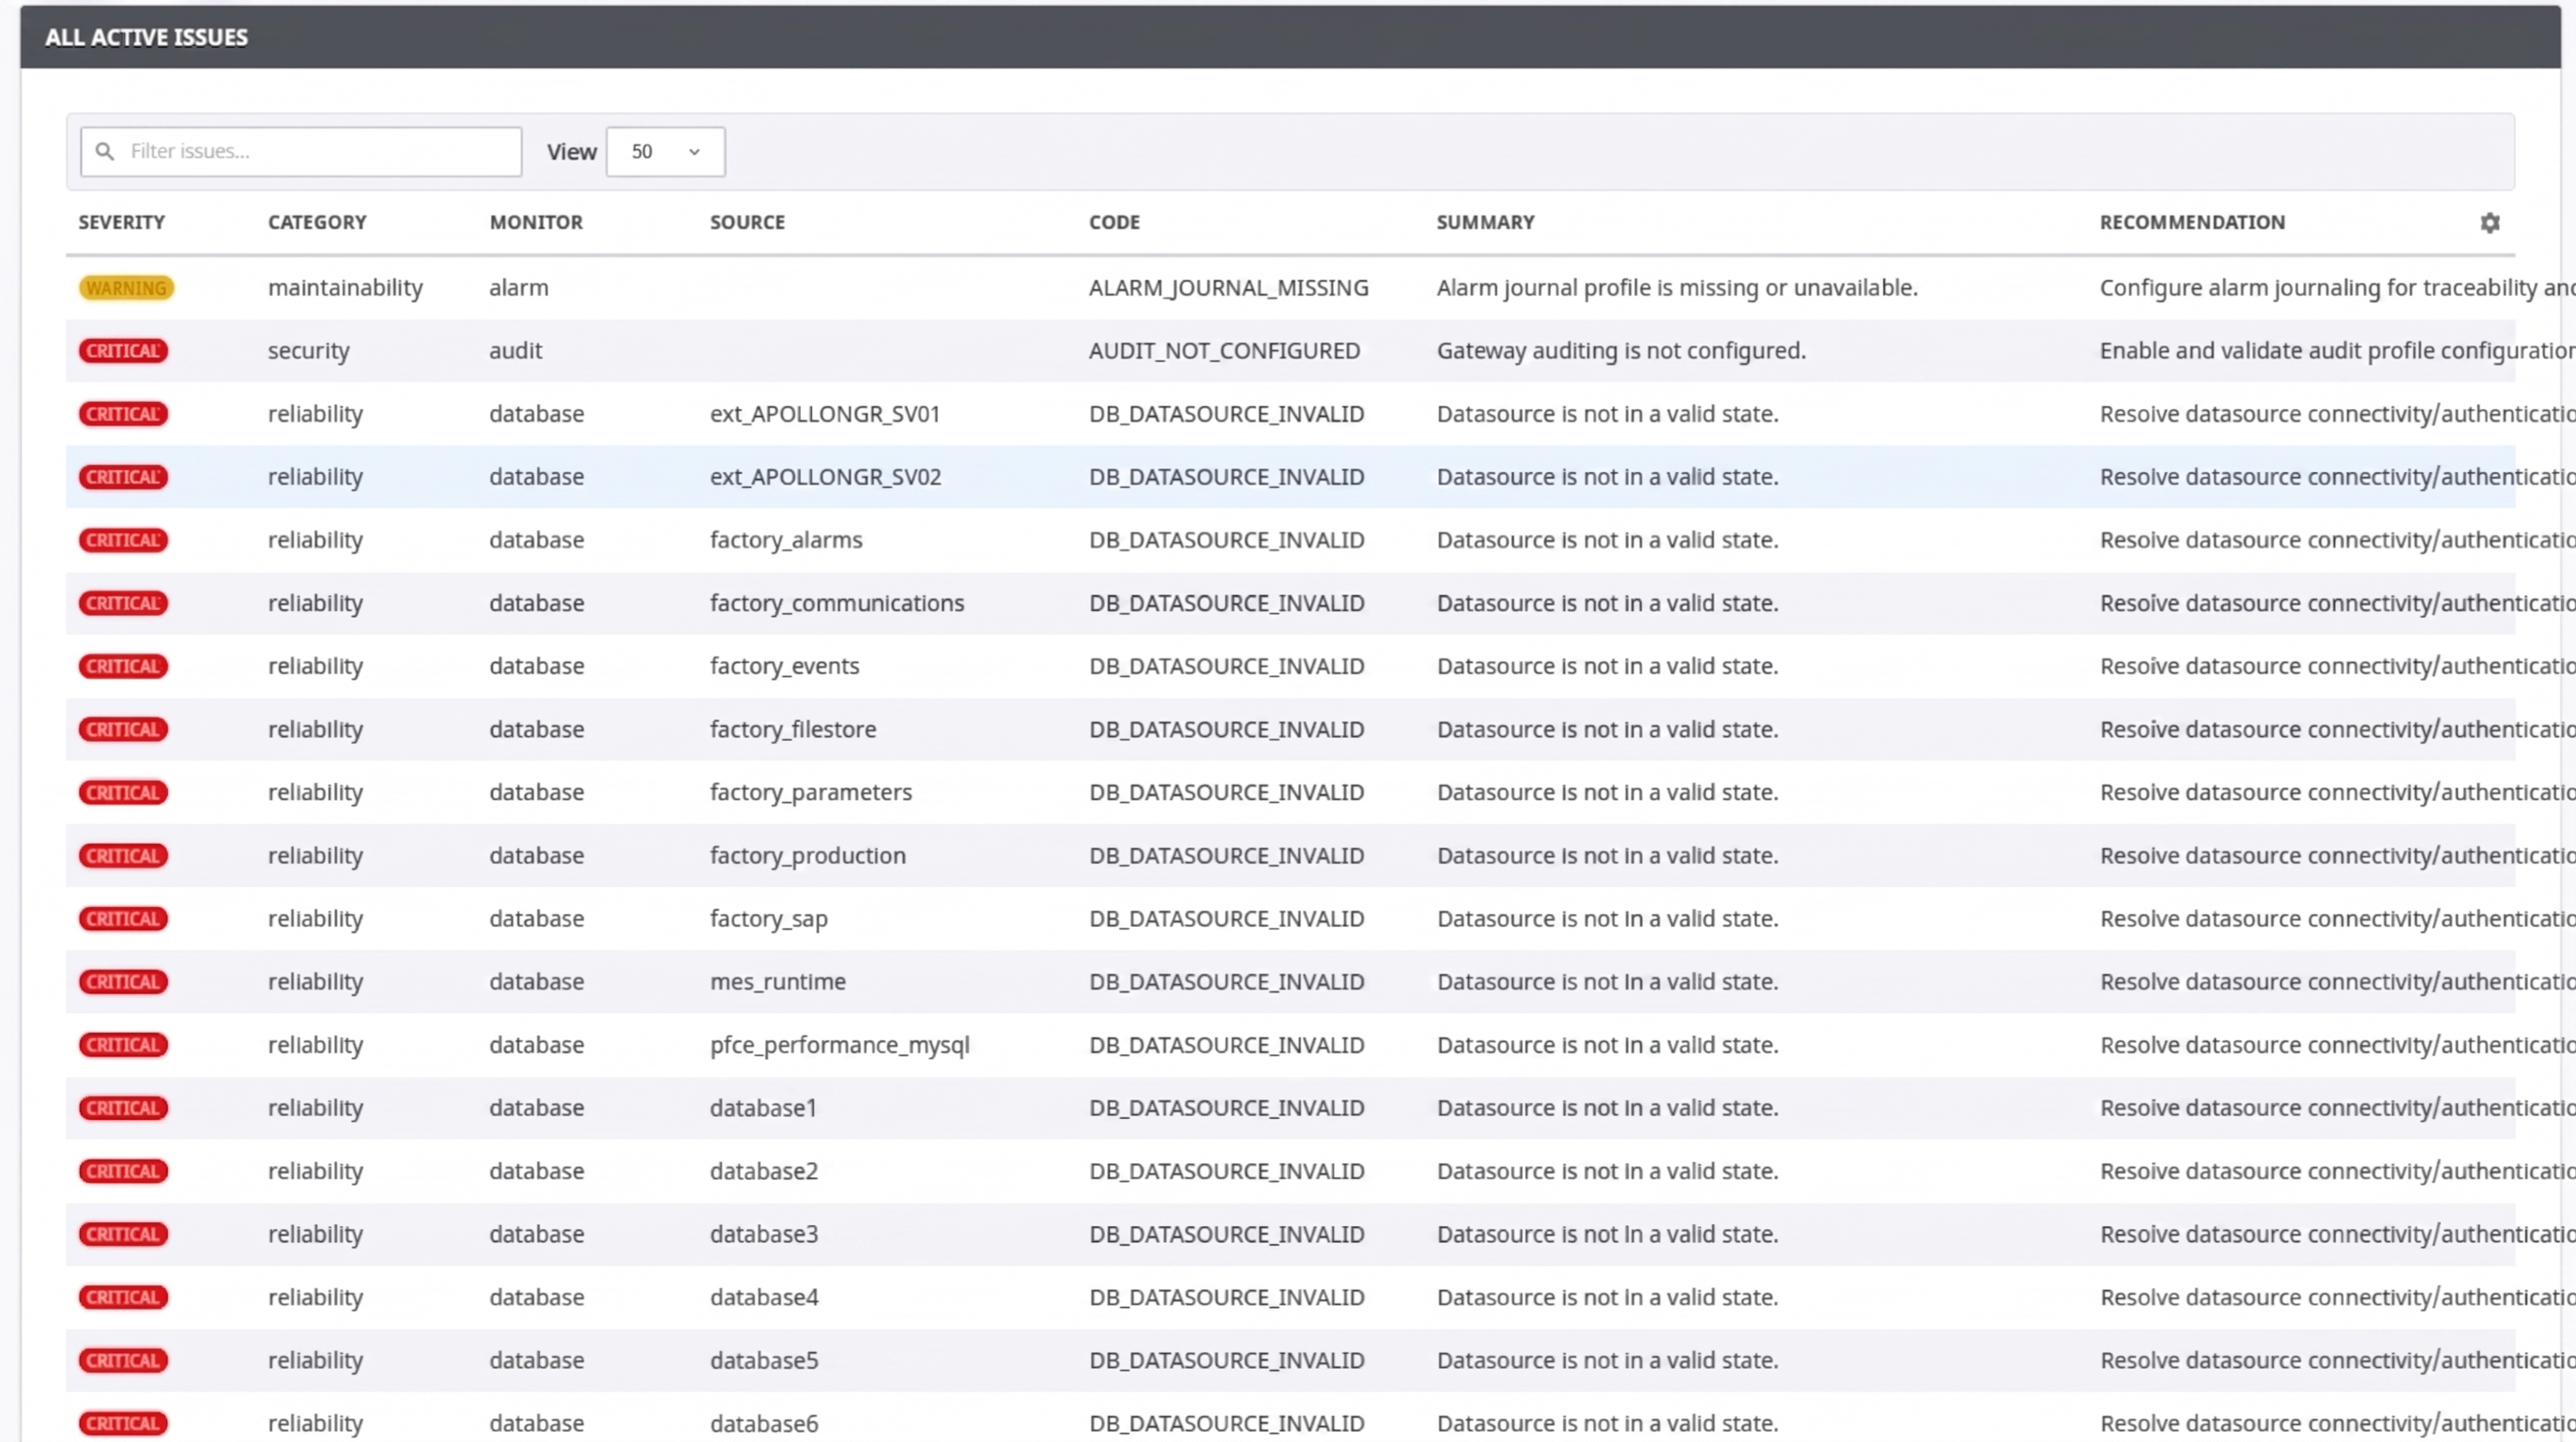
Review findings as diagnostic guidance. Investigate conditions using normal Gateway administration, logs, and project context before making production changes.
Analysis
Analysis lets users browse the available results for each diagnostic area. Select a diagnostic area, use the filter to locate a value, and use Copy path or Copy value when preparing an approved support case or automation reference.
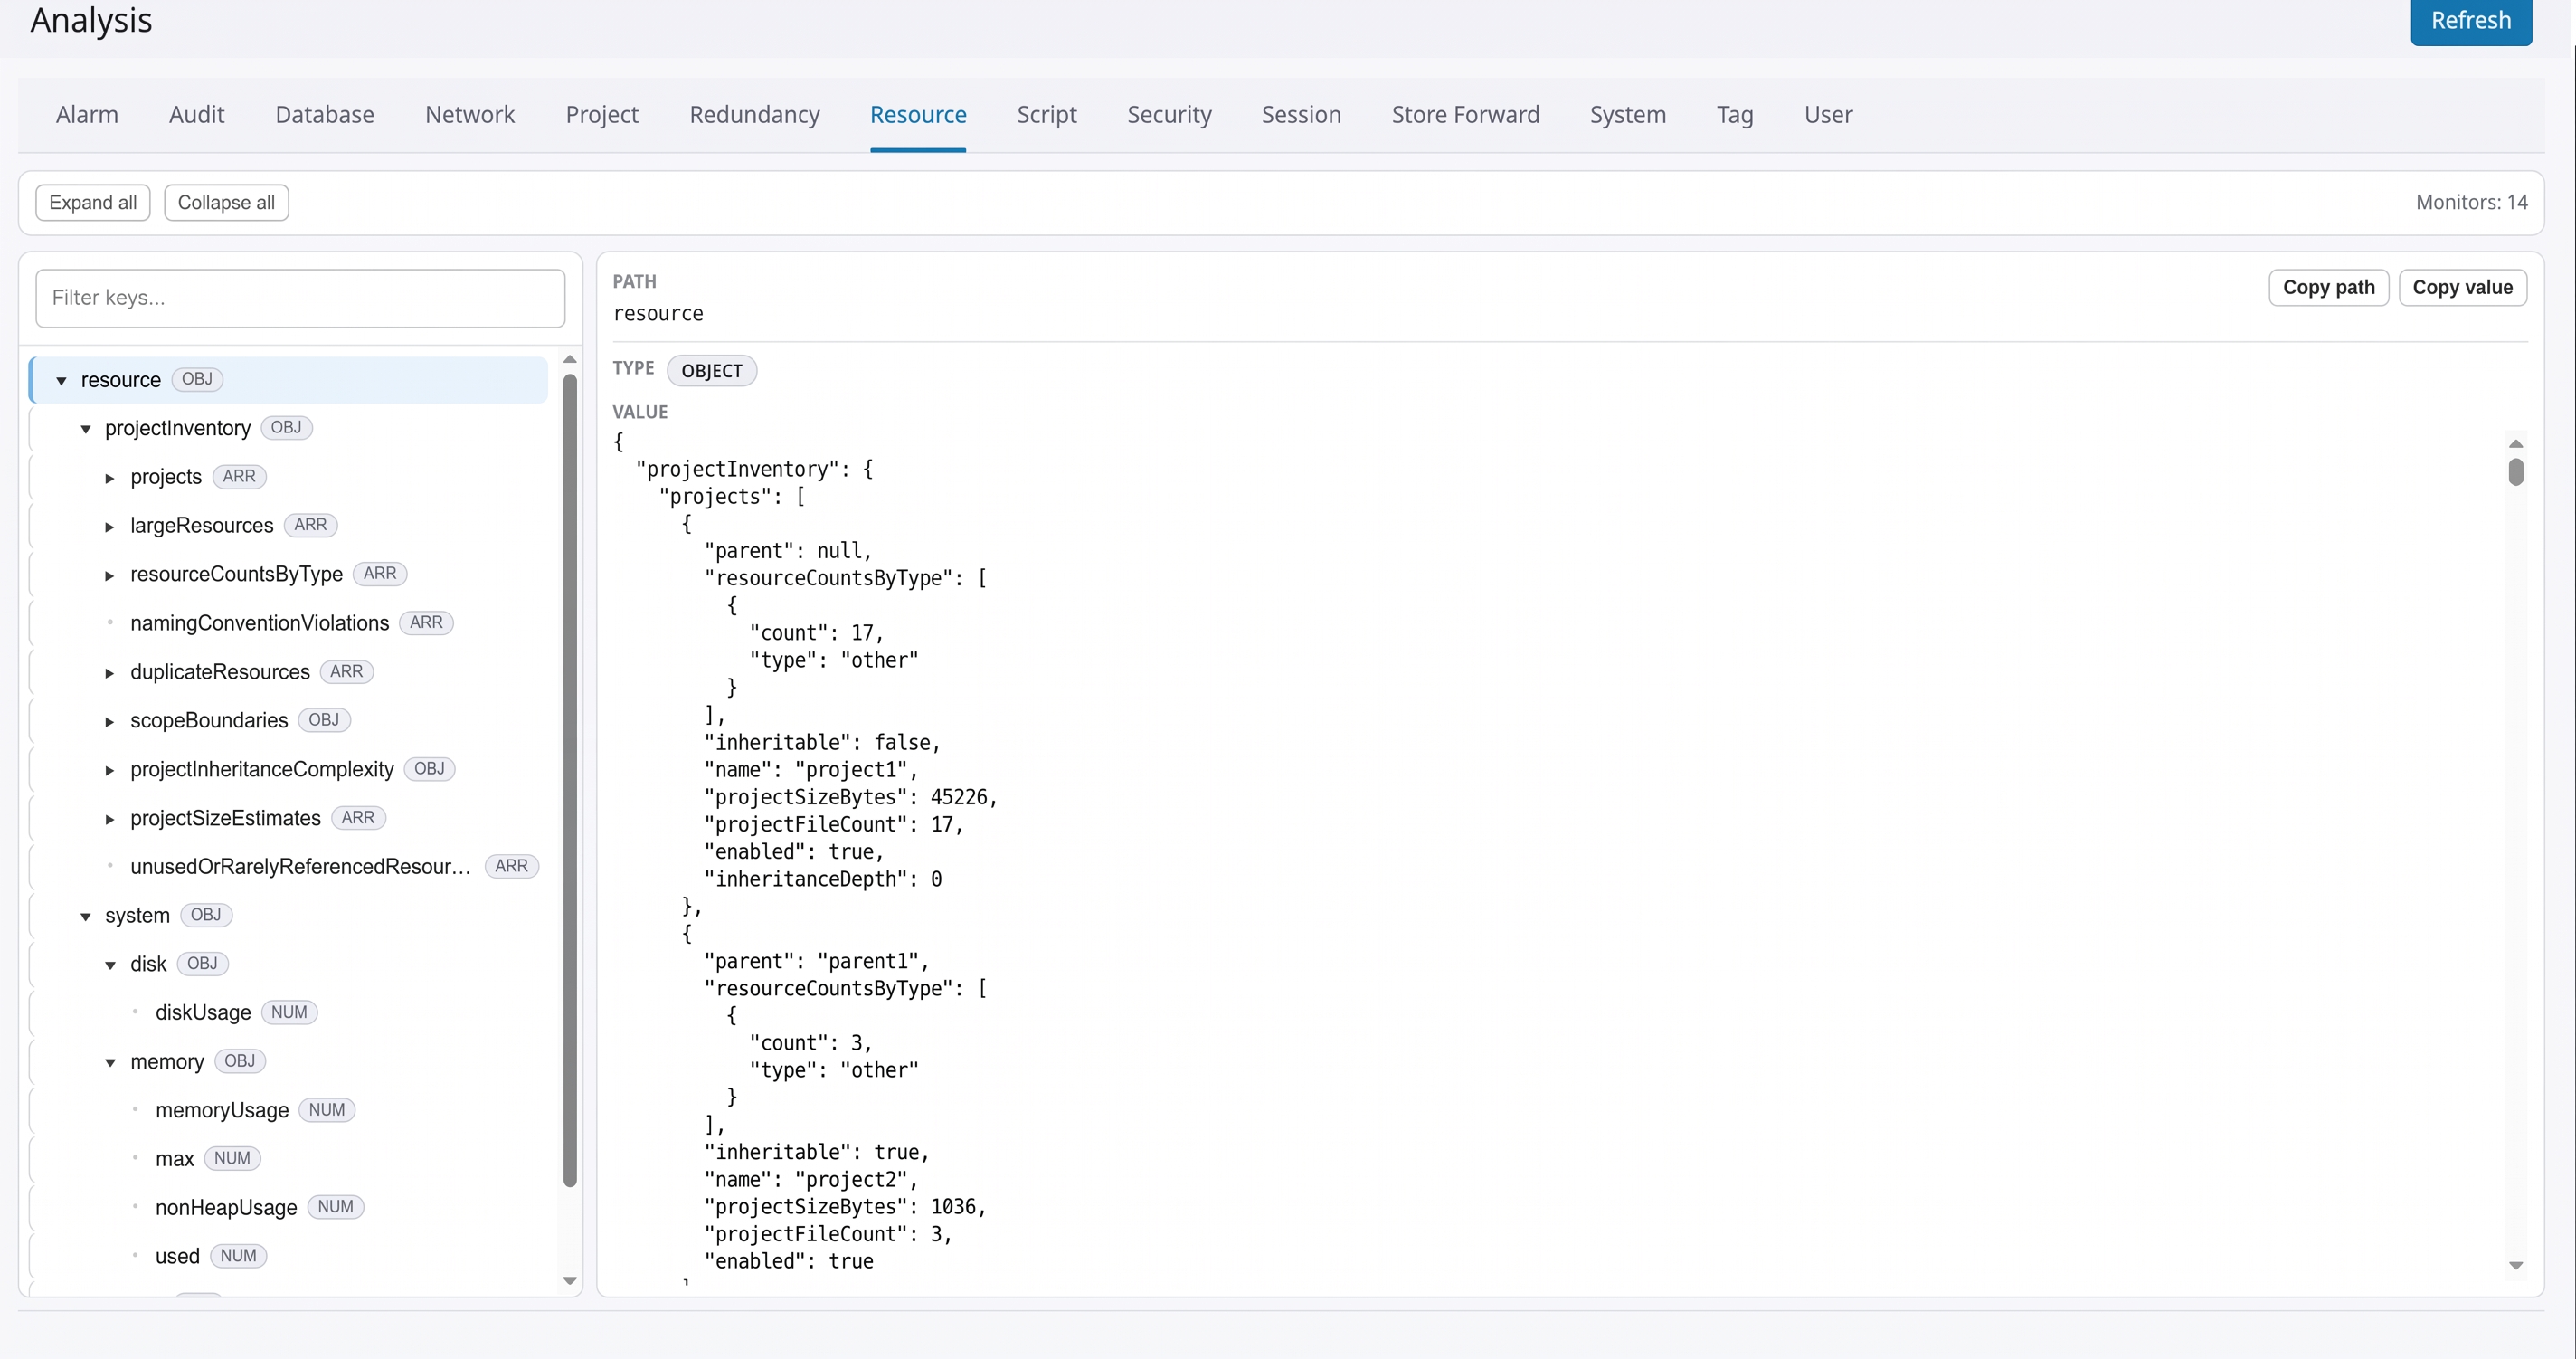
Information shown on this page depends on the currently enabled diagnostic areas, configured filters, available Gateway features, and collection status.
Analyzer settings
Analyzer Settings controls the normal diagnostic scope and output behavior.
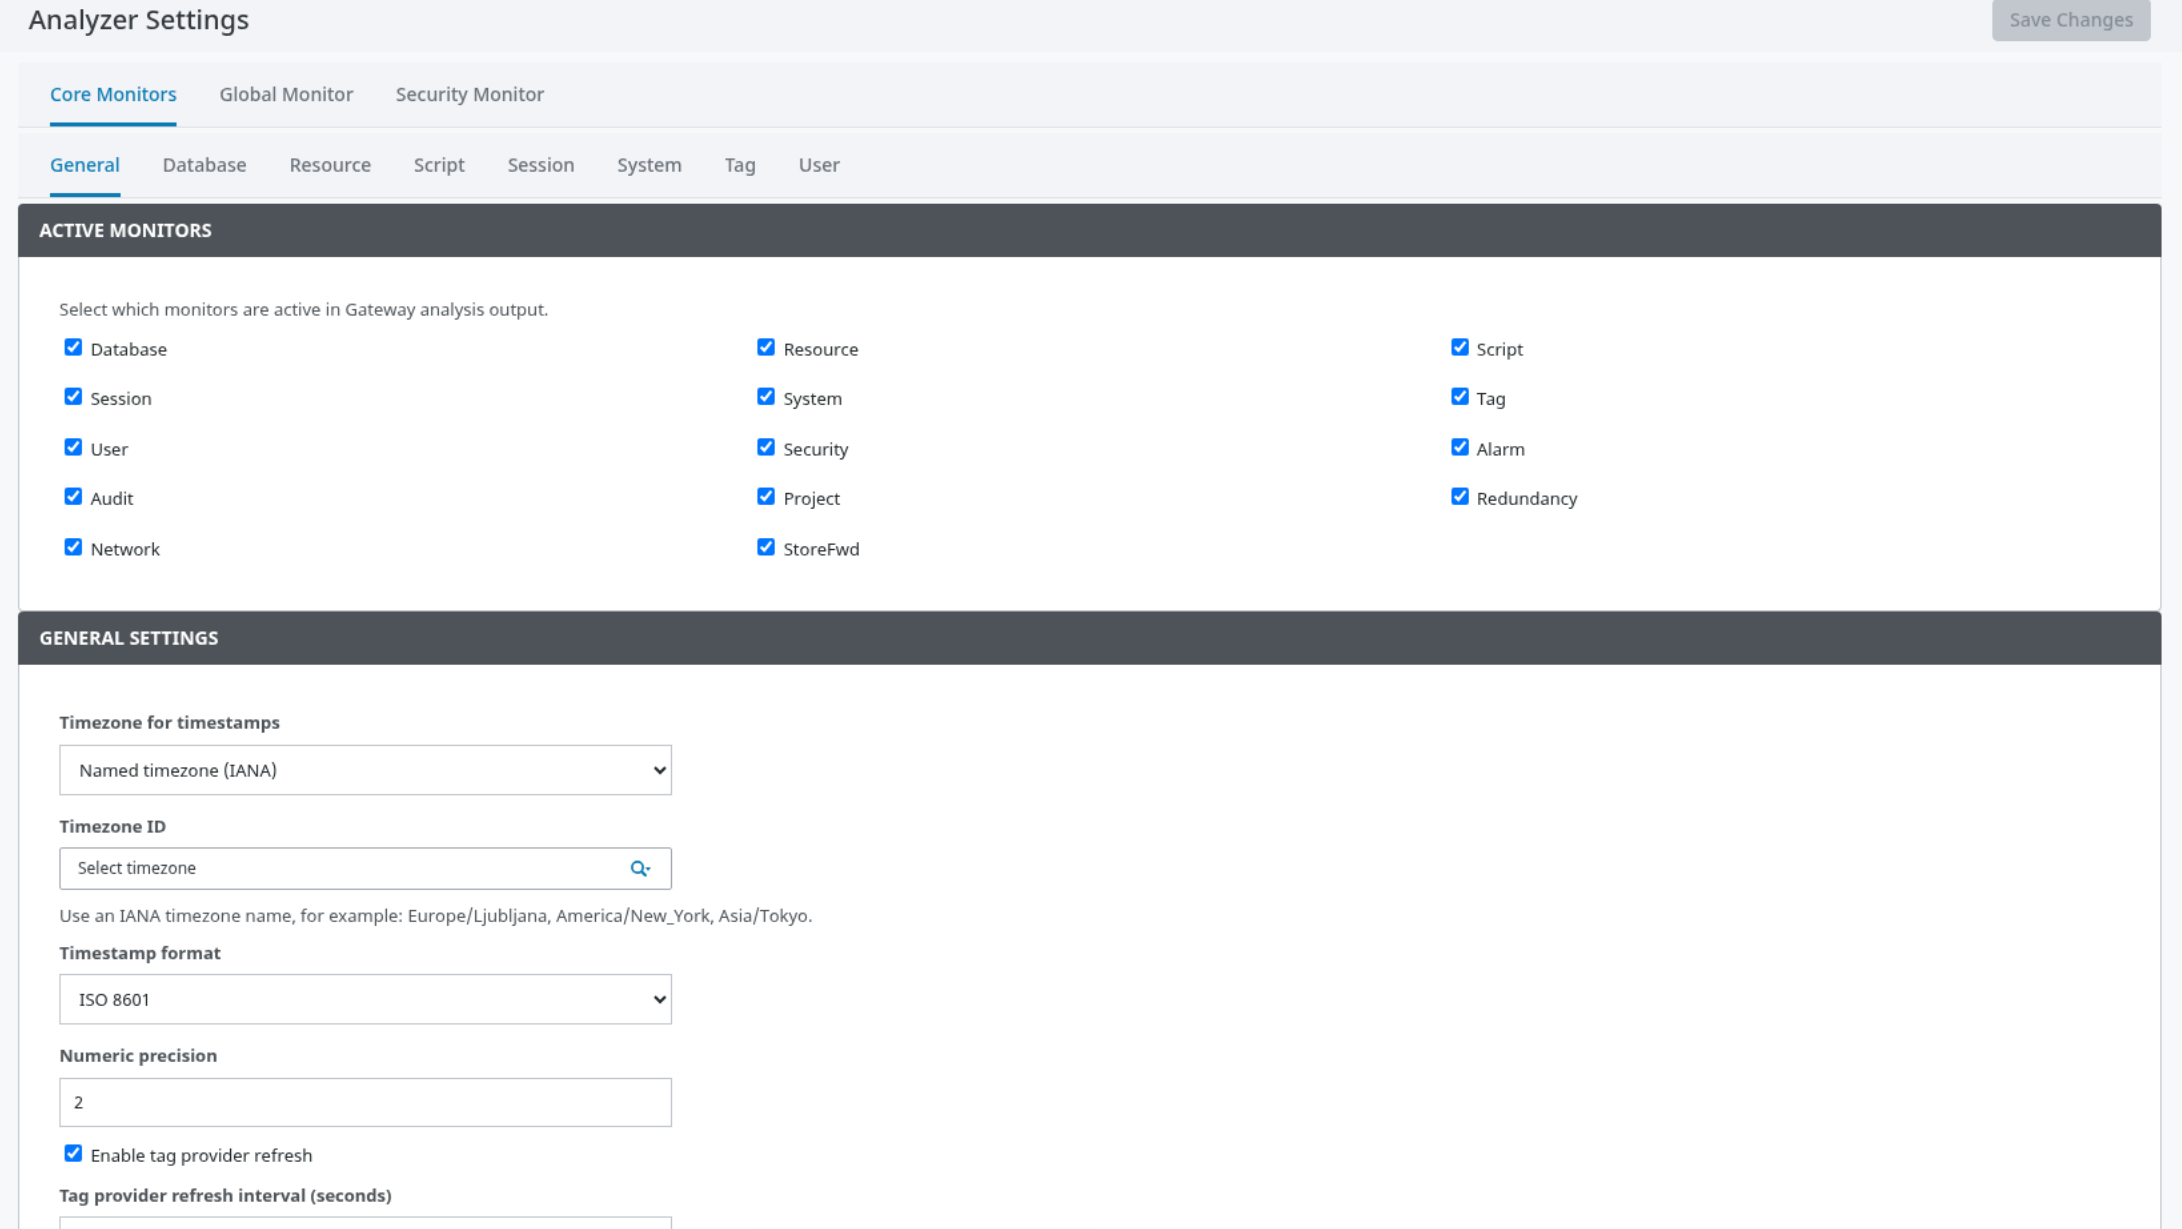
The General tab includes:
-
ACTIVE MONITORS for selecting the diagnostic areas included in normal analysis.
-
Tag-provider refresh controls for module-generated diagnostic tags.
-
Snapshot retention and storage behavior.
-
Configuration import and export.
-
Output presets that balance diagnostic detail against output size.
Additional tabs provide visible options for database, resource, script, session, system, tag, user, security, alarm, audit, project, redundancy, network, and store-and-forward analysis areas. Configure only the options necessary for the intended review.
Select Save Changes after modifying settings. If settings are locked during trial operation, use a fully enabled deployment before attempting administrative changes.
Analysis export
Analysis Export controls download and delivery behavior.
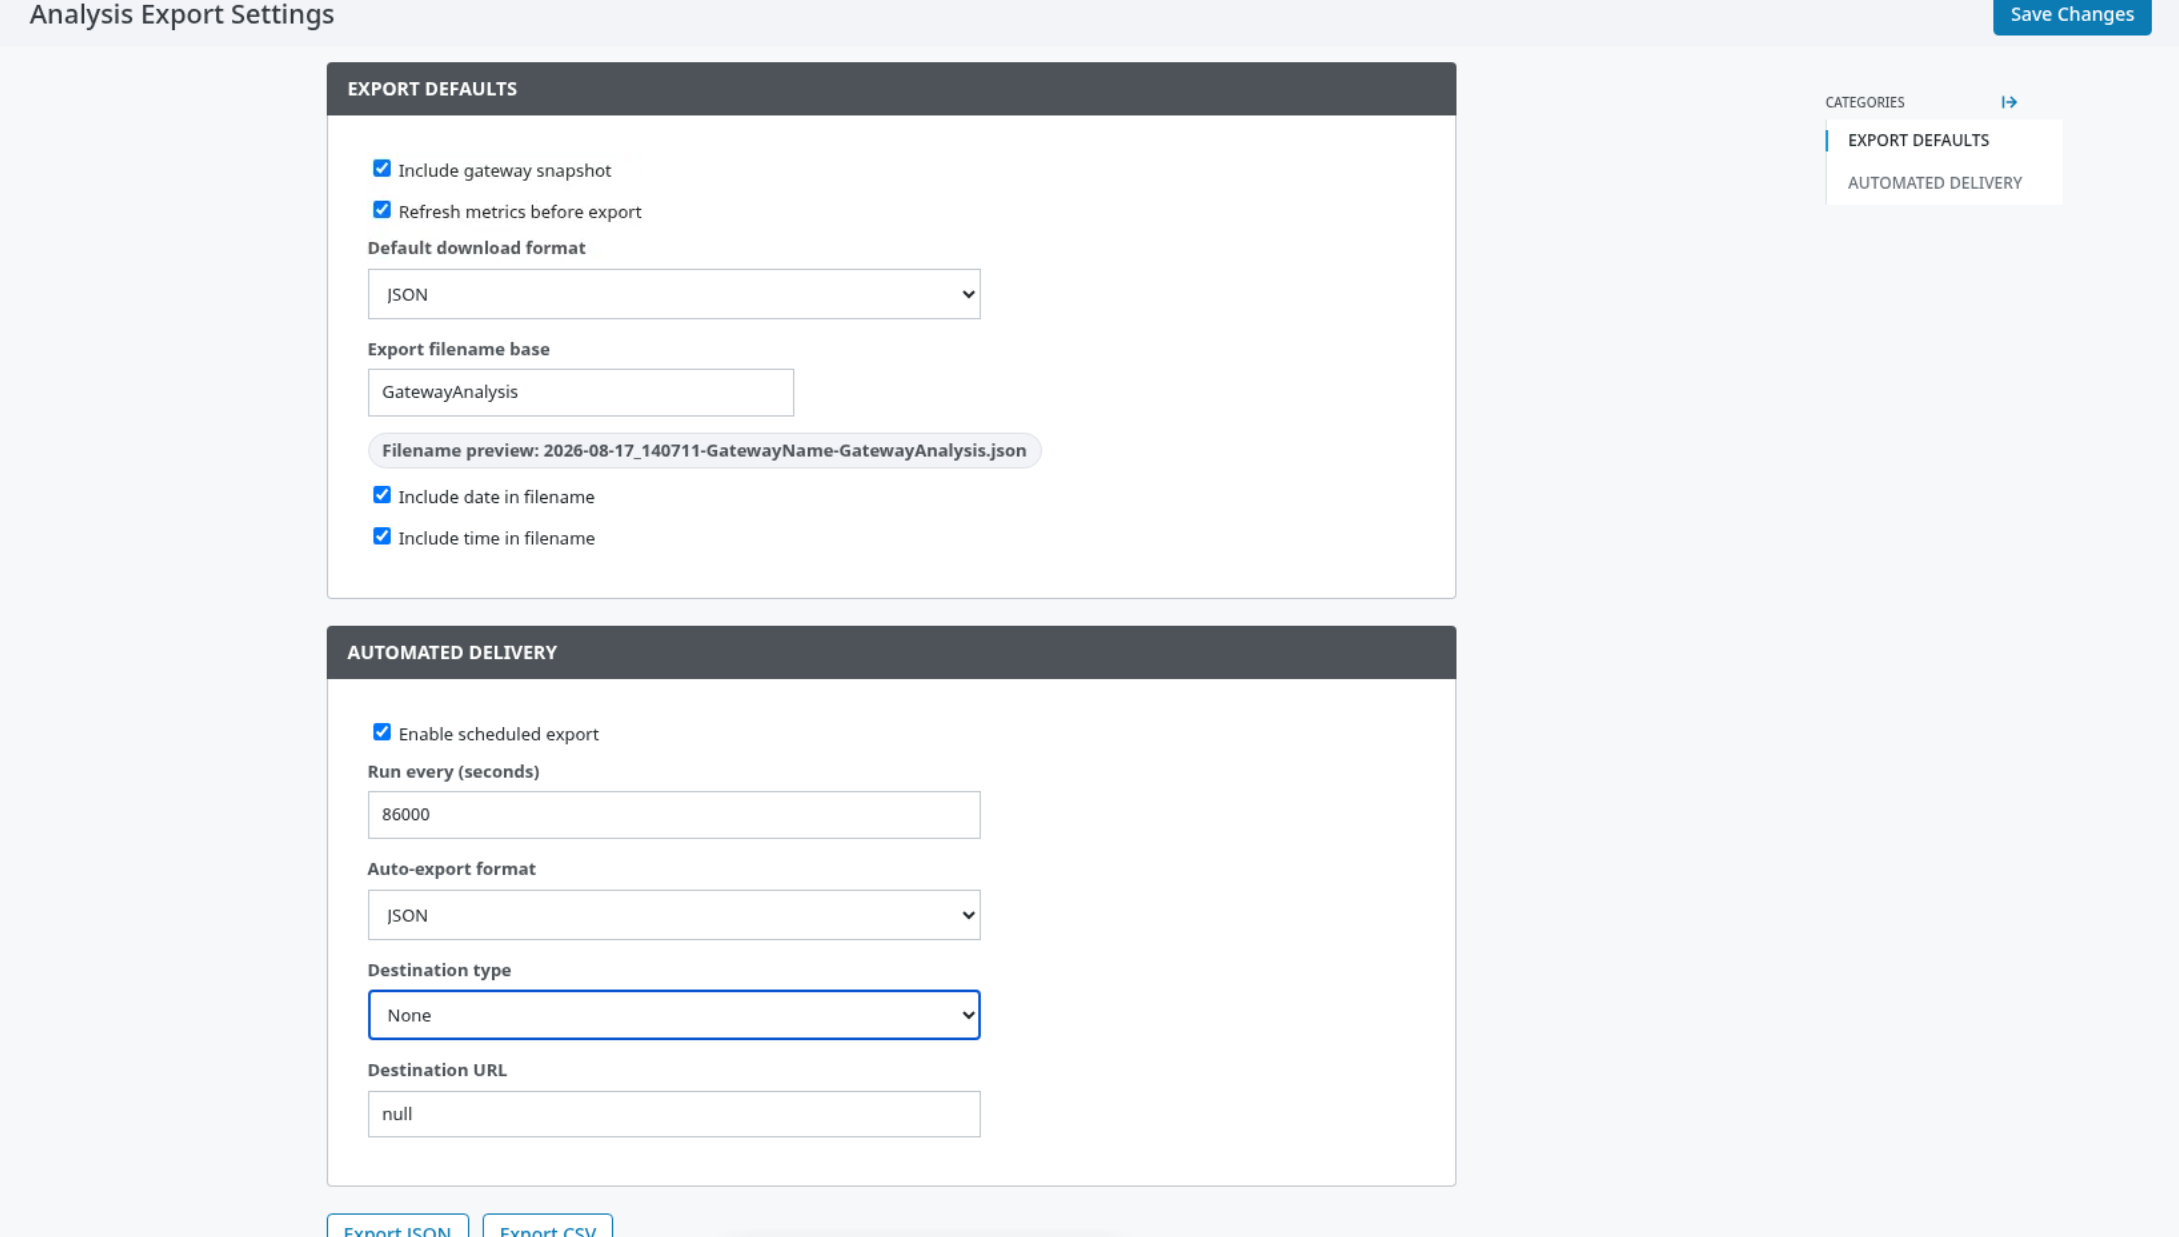
In EXPORT DEFAULTS, choose the default format, filename behavior, whether to include a Gateway snapshot, and whether to refresh diagnostic information before export. Use Export JSON for structured machine-readable output or Export CSV for a report archive.
In AUTOMATED DELIVERY, enable scheduled delivery only after the destination, security controls, and operational ownership have been reviewed. The page supports common web, messaging, file-transfer, and email destination types.
Get snapshot
Purpose: Returns the current Gateway diagnostic snapshot.
Parameters: None.
Returns: A dictionary-like diagnostic result.
Example:
# Run the snapshot function from Gateway scope.
Get system resources
Purpose: Returns current system resource information included in the diagnostic snapshot.
Parameters: None.
Returns: A dictionary-like resource result.
Get modules
Purpose: Returns the available module status information from the current snapshot.
Parameters: None.
Returns: A list of dictionary-like results.
Get data sources
Purpose: Returns datasource information from the current snapshot.
Parameters: None.
Returns: A list of dictionary-like results.
Refresh analysis
Purpose: Requests a fresh diagnostic snapshot and returns it.
Parameters: None.
Returns: A dictionary-like diagnostic result.
Get export data
Purpose: Returns the current structured analysis export data.
Parameters: None.
Returns: A dictionary-like analysis result.
Get export JSON
Purpose: Returns the current analysis export as JSON text.
Parameters: None.
Returns: A JSON string.
These functions are intentionally Gateway-scope only. Client and Designer scope do not provide diagnostic collection or analysis execution.