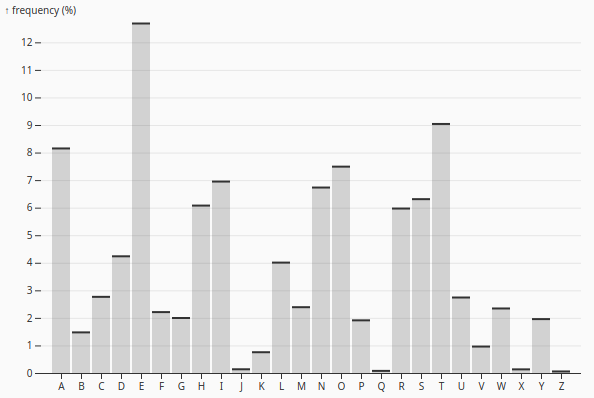
Family base entry: Rules & Ticks, which opens with the Candlestick preset.
Example mark structure:
{
  "data": [
    { "date": "2026-08-20", "open": 150, "high": 156, "low": 149, "close": 154 }
  ],
  "marks": [
    {
      "type": "ruleX",
      "options": { "x": "date", "y1": "low", "y2": "high" }
    },
    {
      "type": "barY",
      "options": { "x": "date", "y1": "open", "y2": "close", "tip": true }
    }
  ]
}
Candlestick
Candlestick
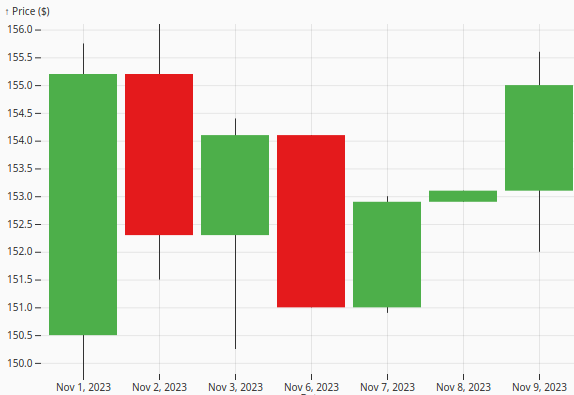
Displays open, high, low, and close values for each time period, making it useful for financial or process trends where the complete range and final movement within each interval need to be visible.
Lollipop
Lollipop
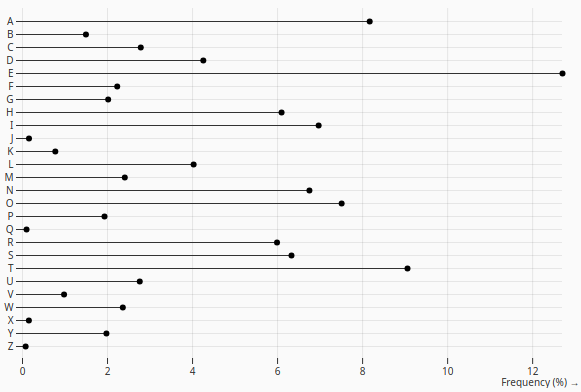
Uses a thin rule ending in a dot as a lower-clutter alternative to a bar, helping compare values while keeping the chart lightweight and easy to scan.
Band
BandChart
Displays a range or uncertainty interval together with a central value, which is useful for showing confidence bands, tolerance limits, forecasts, or expected operating envelopes.
Barcode
Barcode
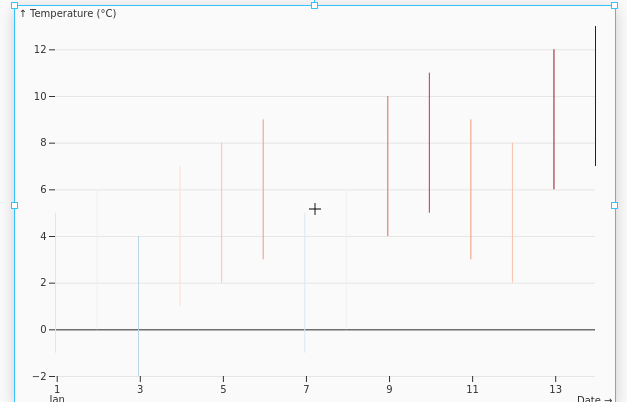
Represents events along a timeline as dense vertical rules, making clusters, gaps, frequency changes, and event timing patterns easy to identify at a glance.
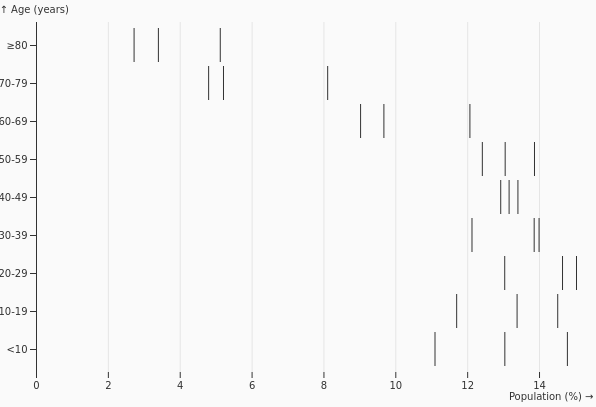
Bar and Tick
BarTick
Compares a range or bar with a tick indicating an actual, target, or reference value, supporting compact performance comparisons against benchmarks or expected values.